
Budget trends help you spot categories that are rising, falling, or regularly exceeding the plan. Open a category’s transactions when you want to understand a surprising month.
What makes a fair comparison?
A partial month won’t tell the same story as a completed one. Missing bank history, an annual bill, or a category you recently reorganized can also explain a change.
One expensive month doesn’t erase your progress. Look for a pattern before changing the plan.
Monthly reports provide another way to review a completed month.
On the web
Switch to Trends
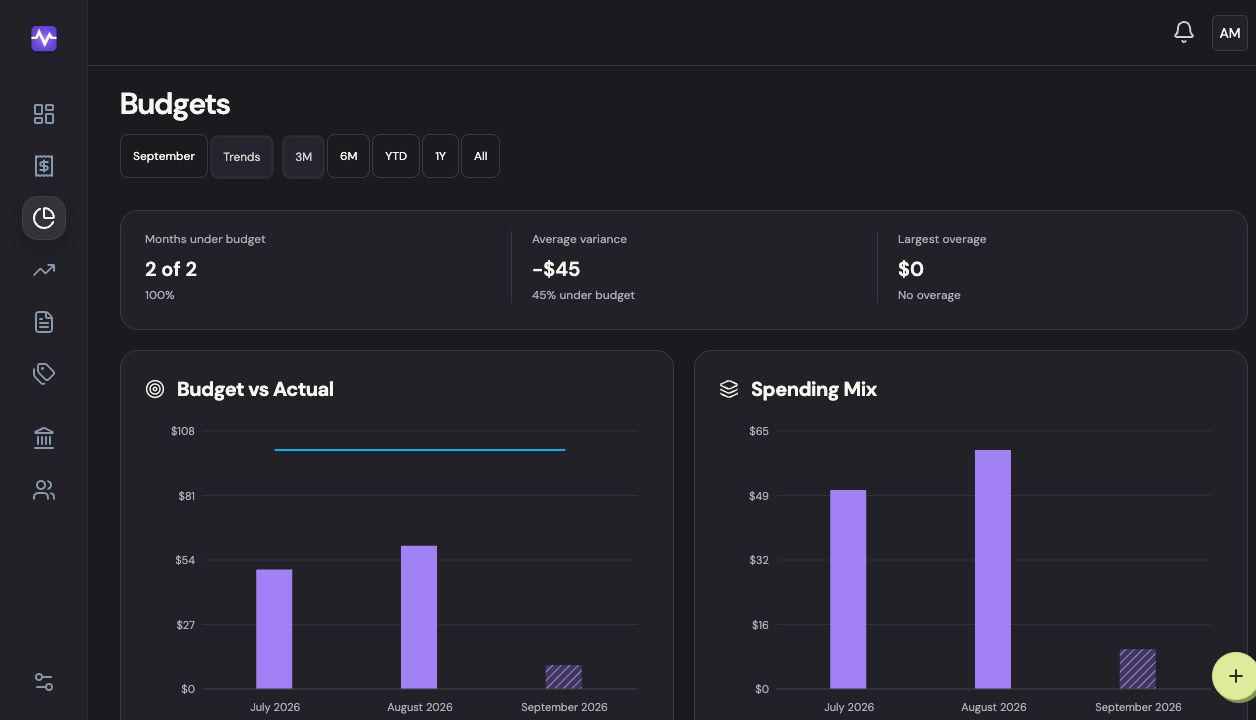
Open Budgets and choose Trends at the top.
Switch to TrendsTap to enlarge Choose the time range
Choose 3M, 6M, YTD, 1Y, or All. Compare completed months; the current month is still in progress.
Choose the time rangeTap to enlarge Read the exact numbers
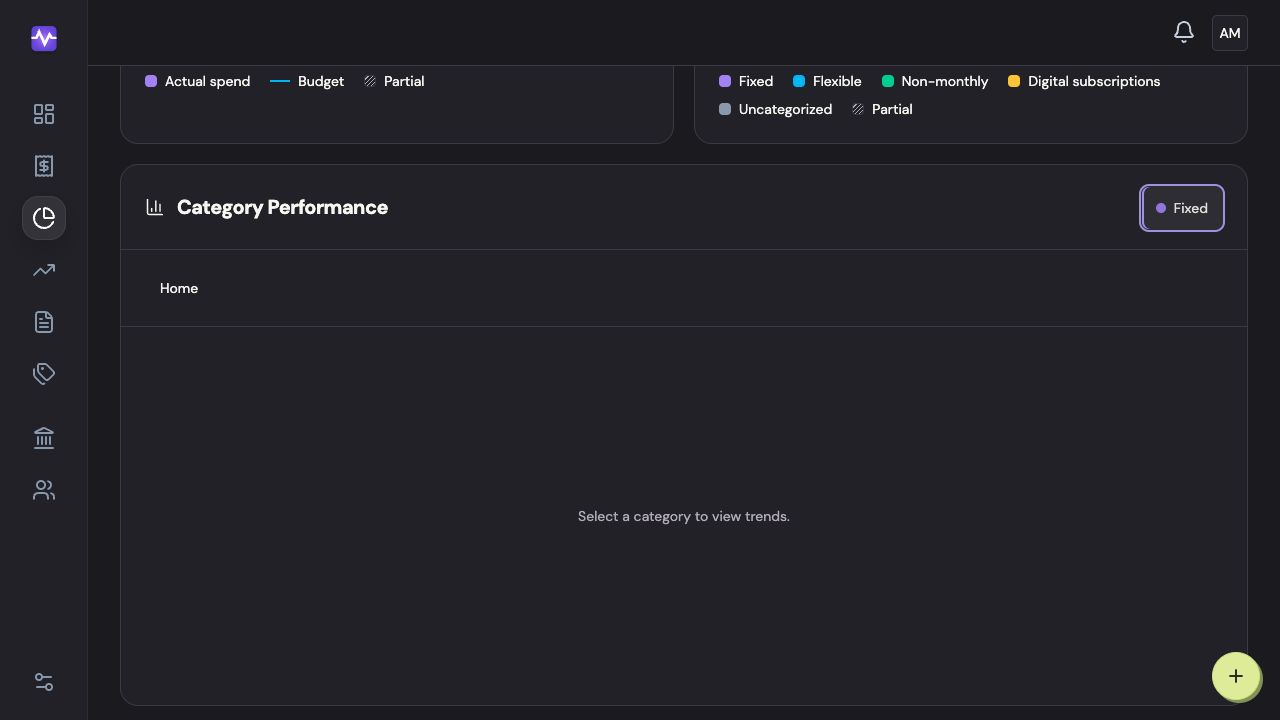
Use View data table below a chart to see its values as a table.
Read the exact numbersTap to enlarge
On iPhone
Switch to Trends
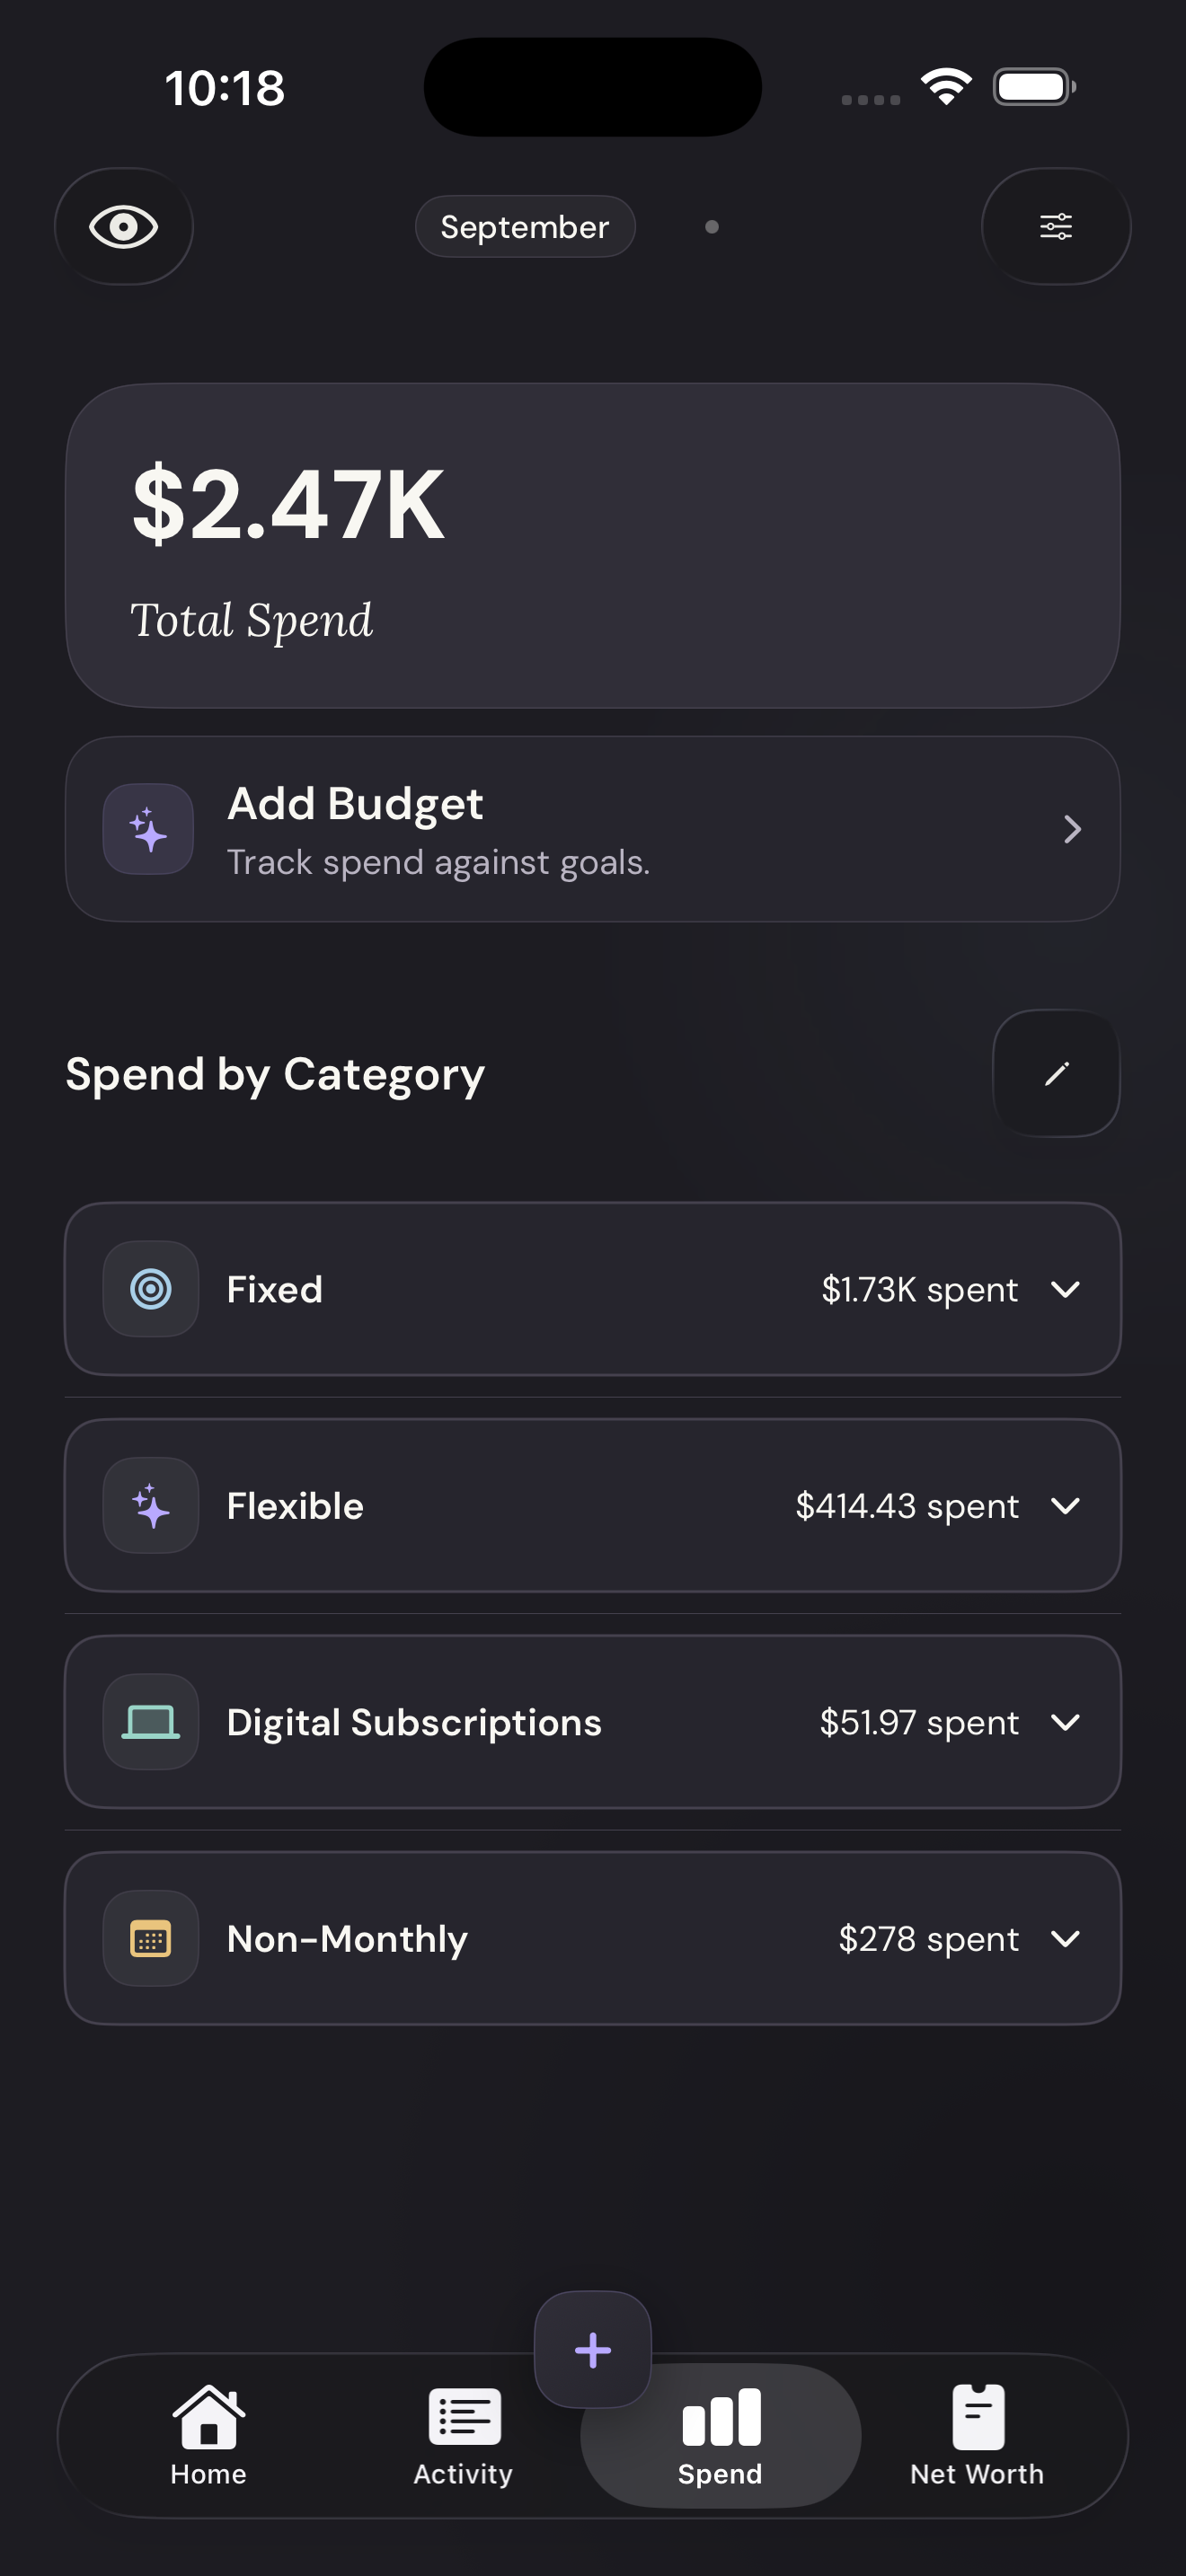
On Spend, tap the month/Trends switch at the top of the screen.
Switch to TrendsTap to enlarge Choose a time range
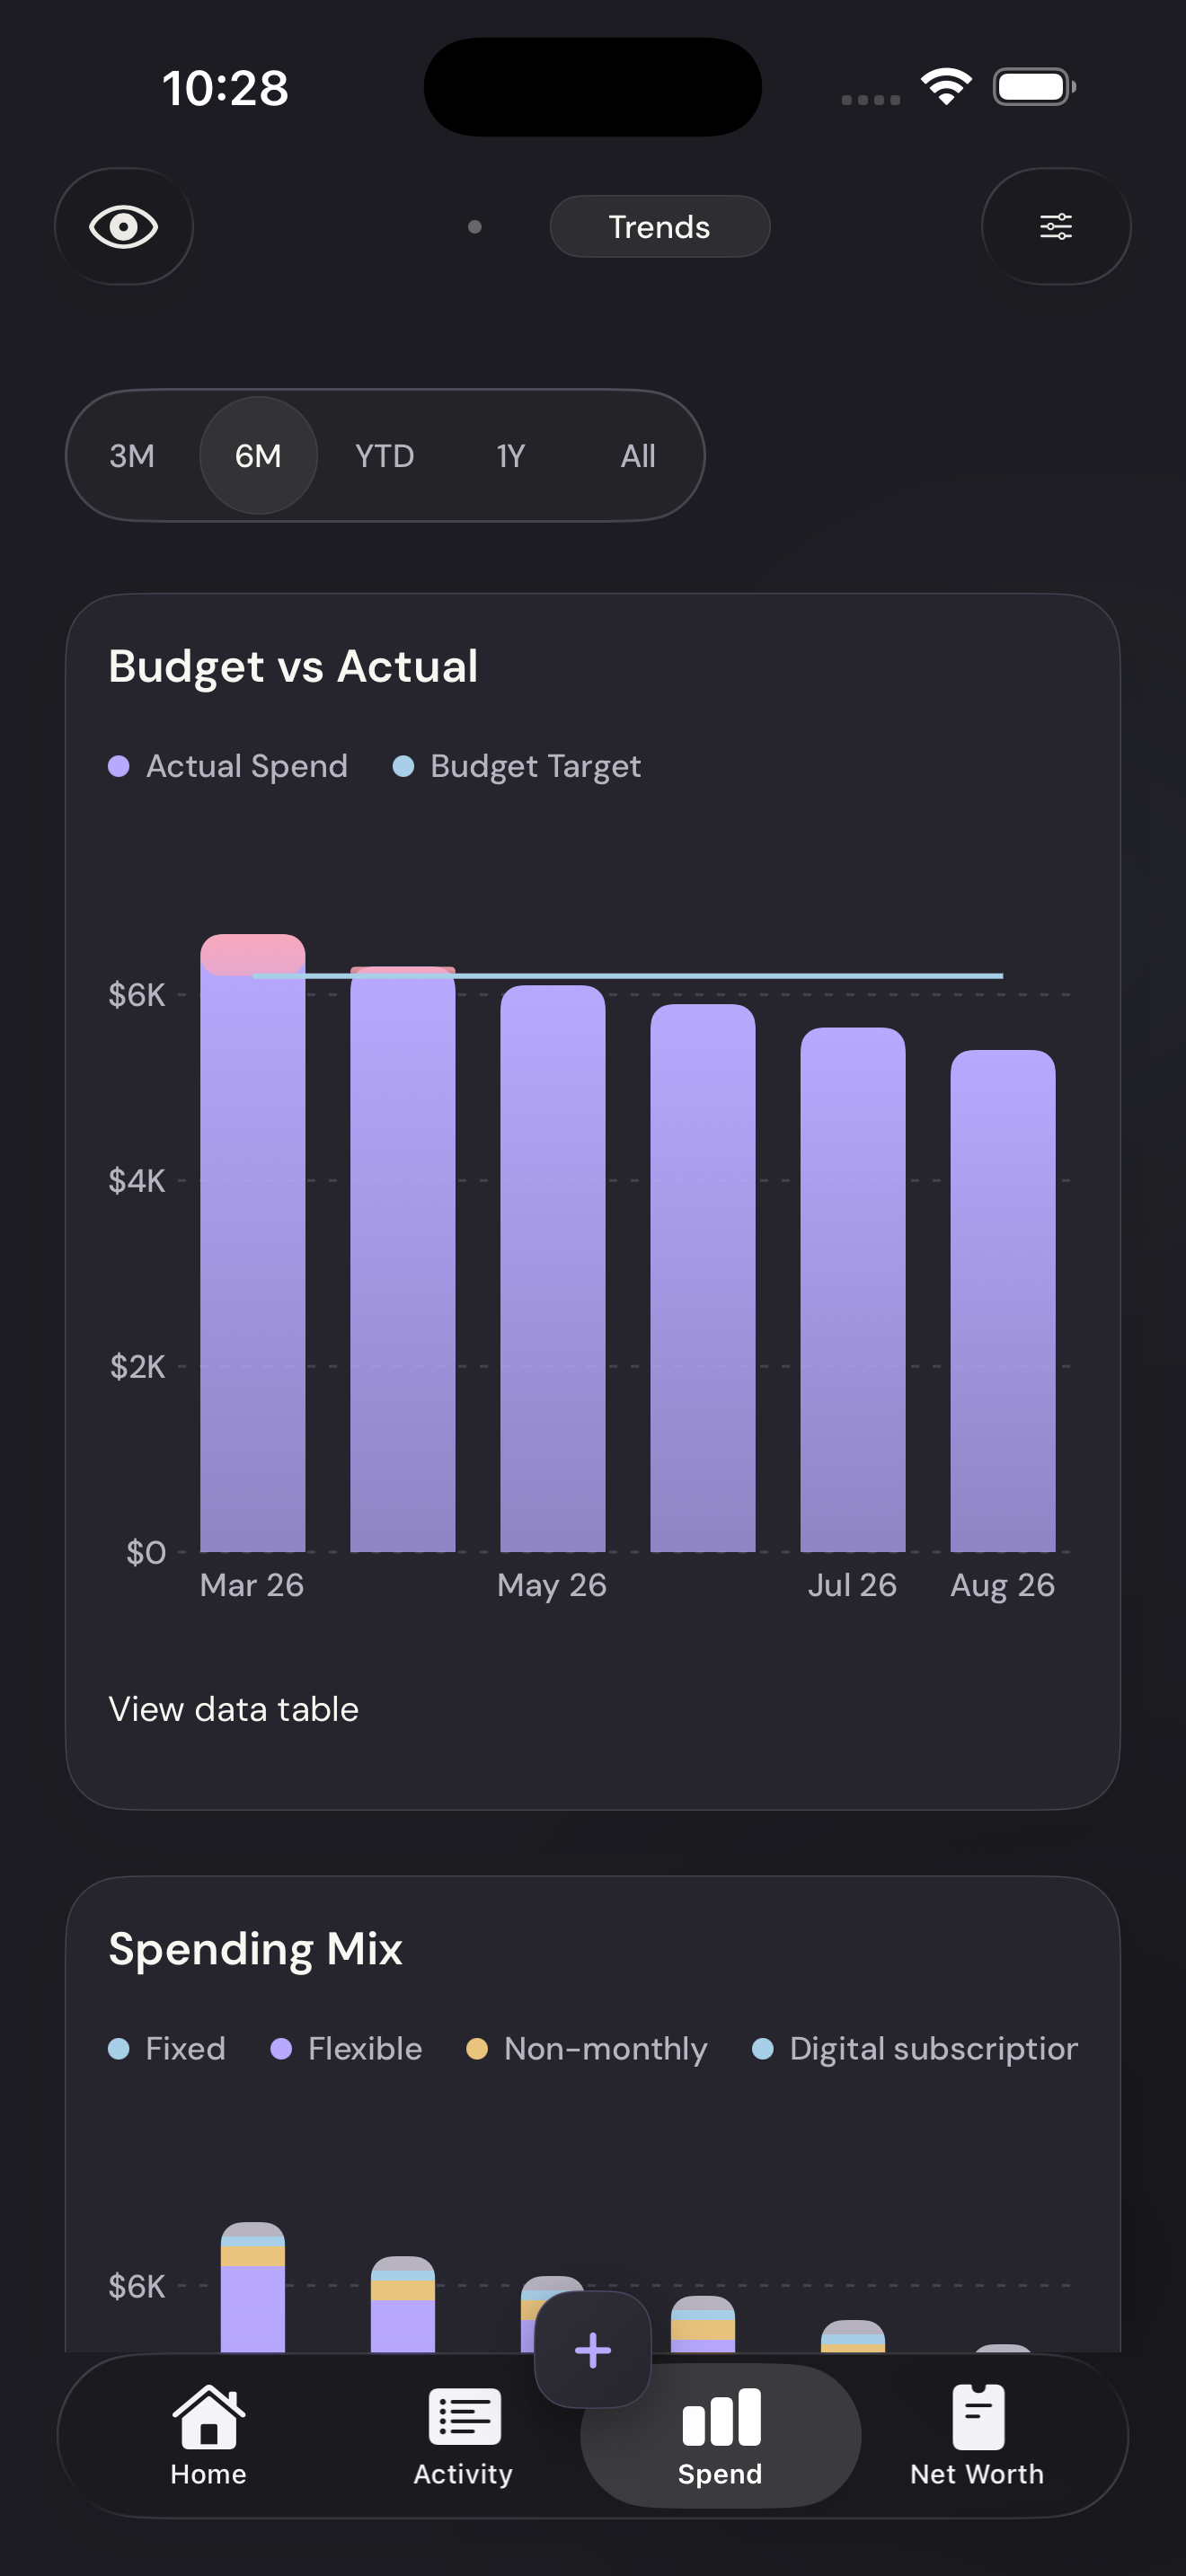
Use the range control above Budget vs Actual.
Choose a time rangeTap to enlarge Open the data table
Tap View data table below the chart for the monthly figures.
Open the data tableTap to enlarge Compare the months
Each row shows actual spending and the budget for that month. Tap Done to return to the chart.
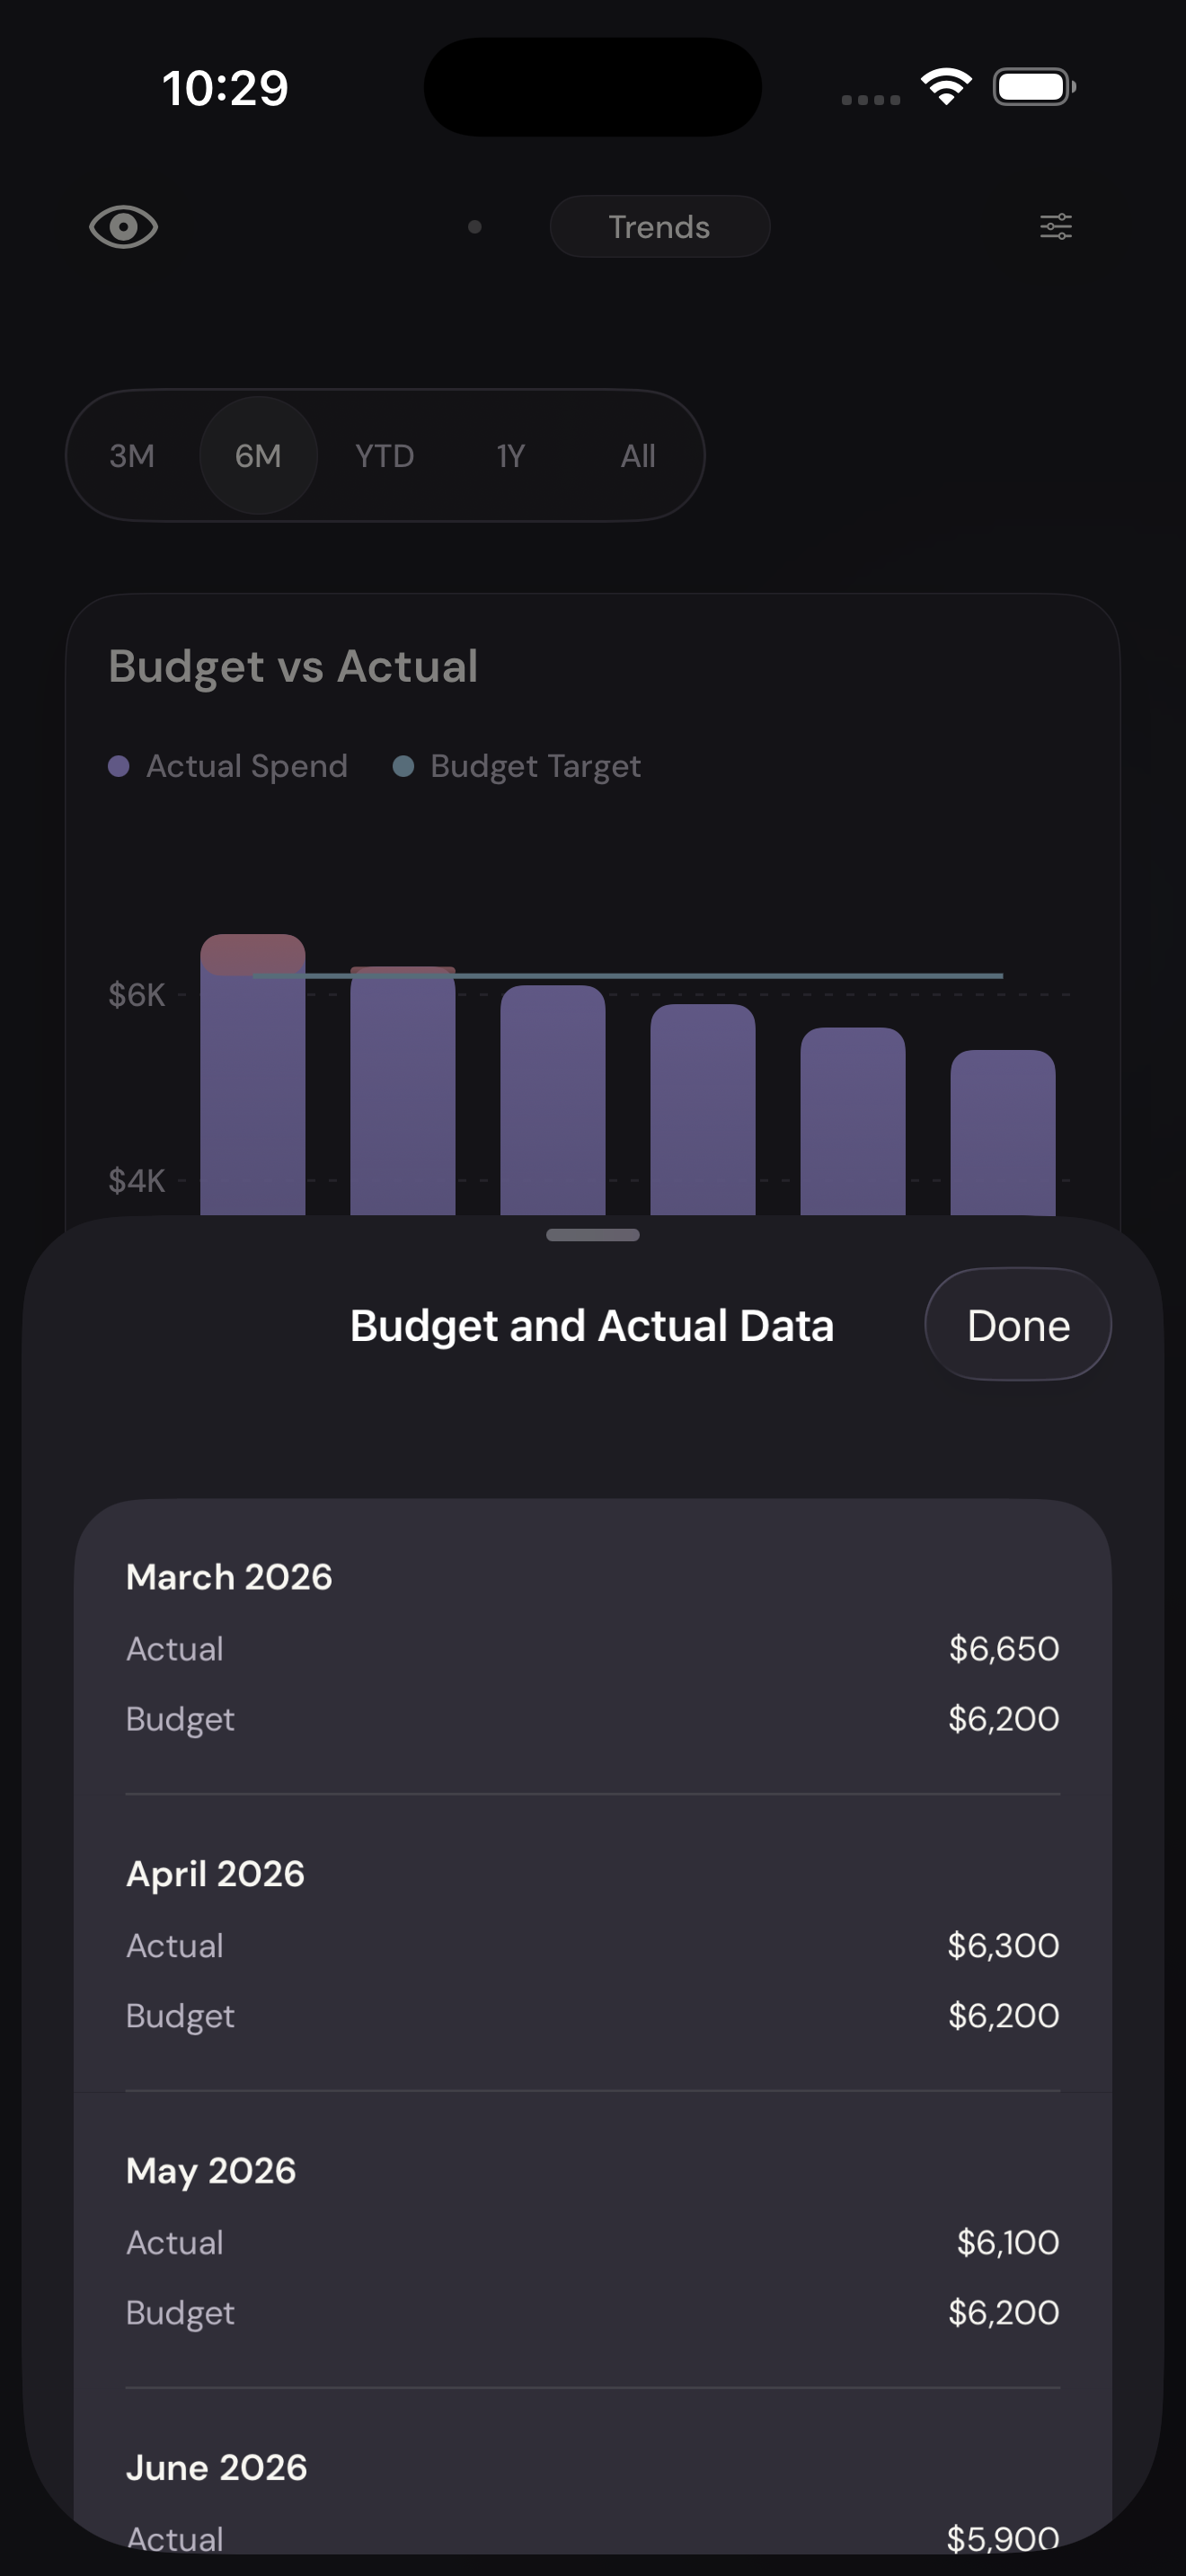
Compare the monthsTap to enlarge